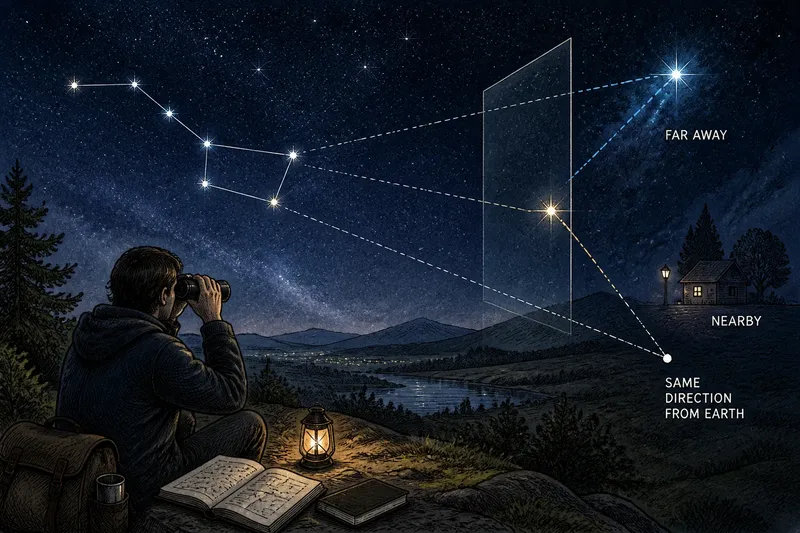
The Star Chart Before the Smartphone
Learn how printed star charts developed before smartphones, why their makers chose particular projections and symbols, and what those choices reveal about astronomy.
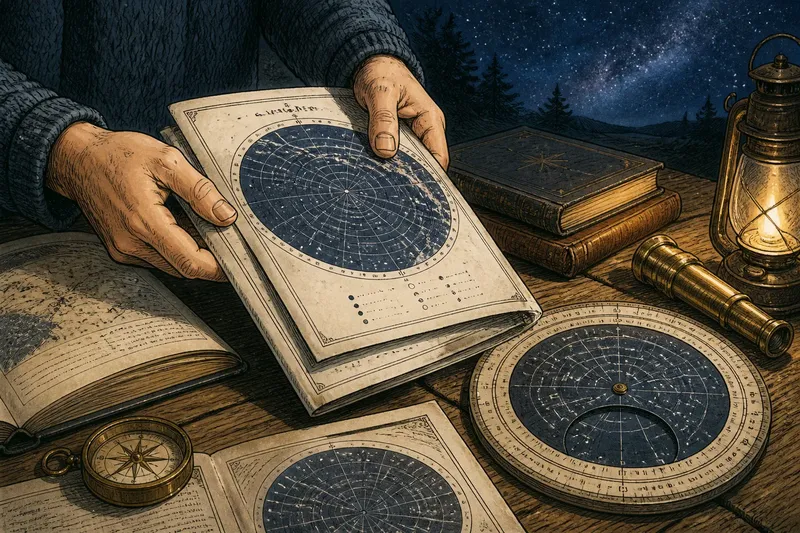
At a kitchen table, someone folds a paper star atlas shut before carrying it outside to compare its page with the dark sky. The star chart before the smartphone was not merely a simpler screen: it belonged to a long history of deciding how celestial knowledge could fit on paper and travel to readers.
How did printed star charts inherit an older tradition?
People have represented stars on durable surfaces for centuries, using drawings, lists, globes, and maps to preserve patterns and guide observation. Printed charts brought such representations into a form that could be copied and circulated. Their pages linked astronomical knowledge to the practical work of printing, binding, teaching, and observing.
As printing became more accessible, charts served different readers. A broad sky map could introduce familiar patterns, while a detailed atlas helped a more experienced observer locate dimmer objects. These were not interchangeable products. Each chart reflected choices about what its intended reader needed to see and how much detail a page could carry.
Why did chartmakers make design choices?
The celestial sphere is an imagined shell around Earth on which astronomers describe the apparent positions of stars. To represent part of that curved sphere on a flat sheet, a mapmaker chooses a projection: a method for transferring positions onto paper. Like flattening an orange peel, the process cannot preserve every relationship perfectly. A projection may favor clear directions or useful shapes while distorting other features.
Scale and selection mattered too. A chart crowded with faint stars and fine labels could be difficult to read in low light; a sparse chart could leave an observer without enough landmarks. Makers also chose which objects to name, which patterns to draw, and how to distinguish brightness or other properties. A legend explained the symbols, but it could not remove the underlying editorial decisions.
Those decisions reveal astronomy as both observation and communication. A printed chart did not reproduce the sky neutrally. It organized information for a particular task, audience, and format.
What changed when charts moved beyond the page?
A printed chart stayed fixed while the sky appeared to change with the observer’s location, the season, and the hour. Some charts covered a general region; others were designed for a particular date, time, or latitude. A reader had to notice those limits before treating the page as a guide to the visible sky.
Planispheres addressed part of that problem with a rotating disk and a window. By aligning date and time markings, the user could expose a representation of the sky expected to be visible at that moment. The device did not calculate every detail of the heavens; it made a selected chart easier to adapt without replacing its printed information.
Digital sky tools later made it possible to change location, time, and scale on a display. That convenience shifted some choices from the chartmaker to software and its settings. The older paper chart makes those choices easier to notice because its coverage, labels, and viewpoint are printed in front of the reader.
What do readers ask about the history of printed star charts?
What is a projection on a star chart?
A projection is a method for representing positions on the curved celestial sphere on a flat page. Different methods preserve different features, so a chart’s shape and distortion depend on its purpose.
Why did planispheres have moving parts?
A planisphere’s rotating disk lets a reader align a date and time with a viewing window. The adjustment changes which portion of the printed sky is shown, making a fixed paper instrument useful at different observing moments.
Did every printed chart show the same sky?
No. Charts varied in their intended audience, geographic coverage, level of detail, and selected objects. A general guide and a specialized atlas could represent different amounts of information without either being a complete picture of every visible star.
How can a reader interpret an old star chart?
Start with its title, legend, and any stated location or date range. Then note its projection and orientation before comparing its labels and symbols with another chart; differences may reflect purpose or convention rather than a disagreement about the sky.
How can one chart reveal its intended audience?
Imagine finding an old, hypothetical atlas page labeled for a particular northern latitude, with a compact legend and a sparse field of bright stars. First, read the title and location note to establish its coverage. Next, inspect the legend for dot sizes, lines, and abbreviations. Then compare the page with a more detailed hypothetical atlas of the same region: if the second includes many faint stars and coordinate markings, the first was likely designed for a broad introduction, while the detailed page served readers seeking precise locations. That comparison does not identify every historical user; it shows how printed features can signal different purposes.
To read the history in a chart, examine what it includes as carefully as what it leaves out. A projection, a legend, and a choice of audience all shape the page before an observer ever looks up. The paper itself is evidence of how astronomers and printers made the sky portable and legible.